AI-powered analytics for MongoDB.
Analyzing your MongoDB used to require a developer, code, and tribal knowledge. Not anymore.
Works with MongoDB Atlas, self-hosted, and any connection string.
Getting answers from MongoDB is harder than it should be.
Your data is there. Everyone else is stuck waiting on a developer to pull it out.
You have to ask a developer every time
Every chart starts as a Jira ticket. Write the query, remember which collection holds what, find an afternoon between features. The backlog grows while the answer sits one query away.
BI tools weren't built for MongoDB
Hex, Mode, Looker all speak SQL: tidy rows and stable schemas. MongoDB gives them nested documents, arrays inside arrays, fields that showed up last Tuesday. Works on the demo, breaks on your data.
ETL to a warehouse is a six month detour
Stand up the pipeline, model the documents into tables, pay for the warehouse, watch the schema drift. Six months and a recurring bill later, you're answering questions your database already knew.
From your MongoDB collections
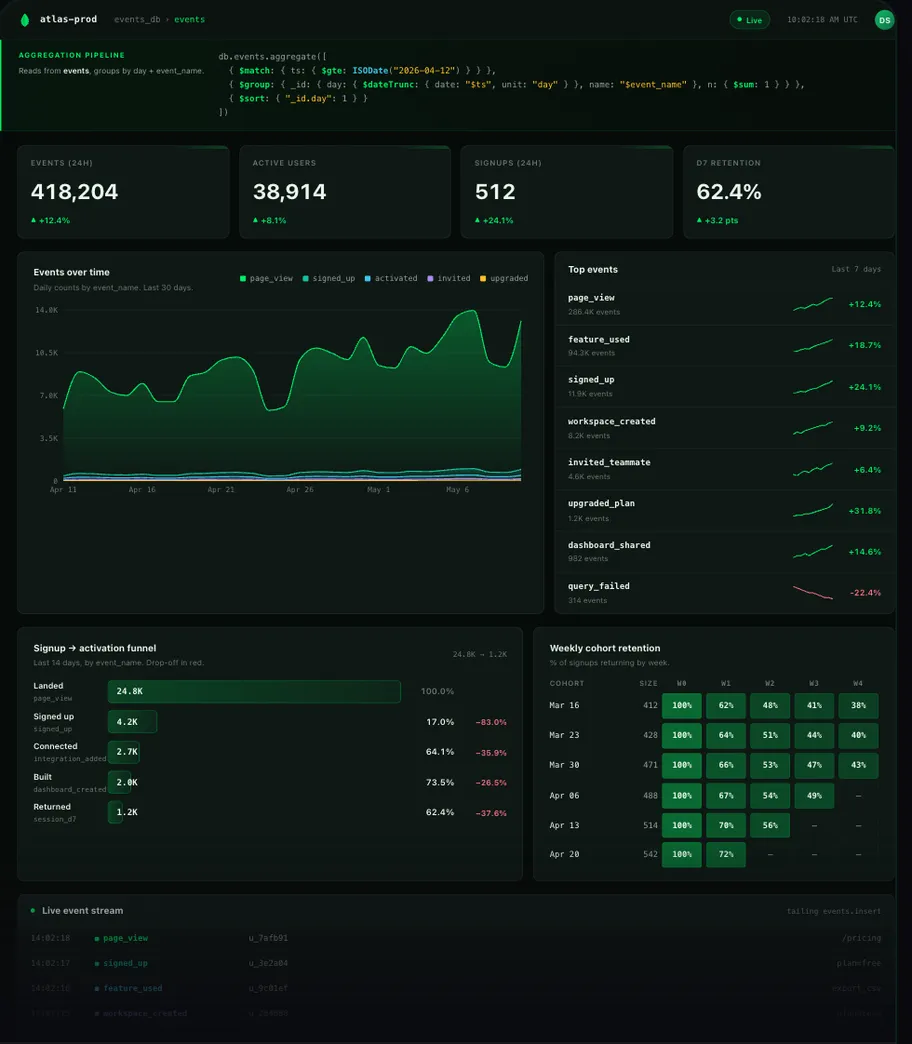
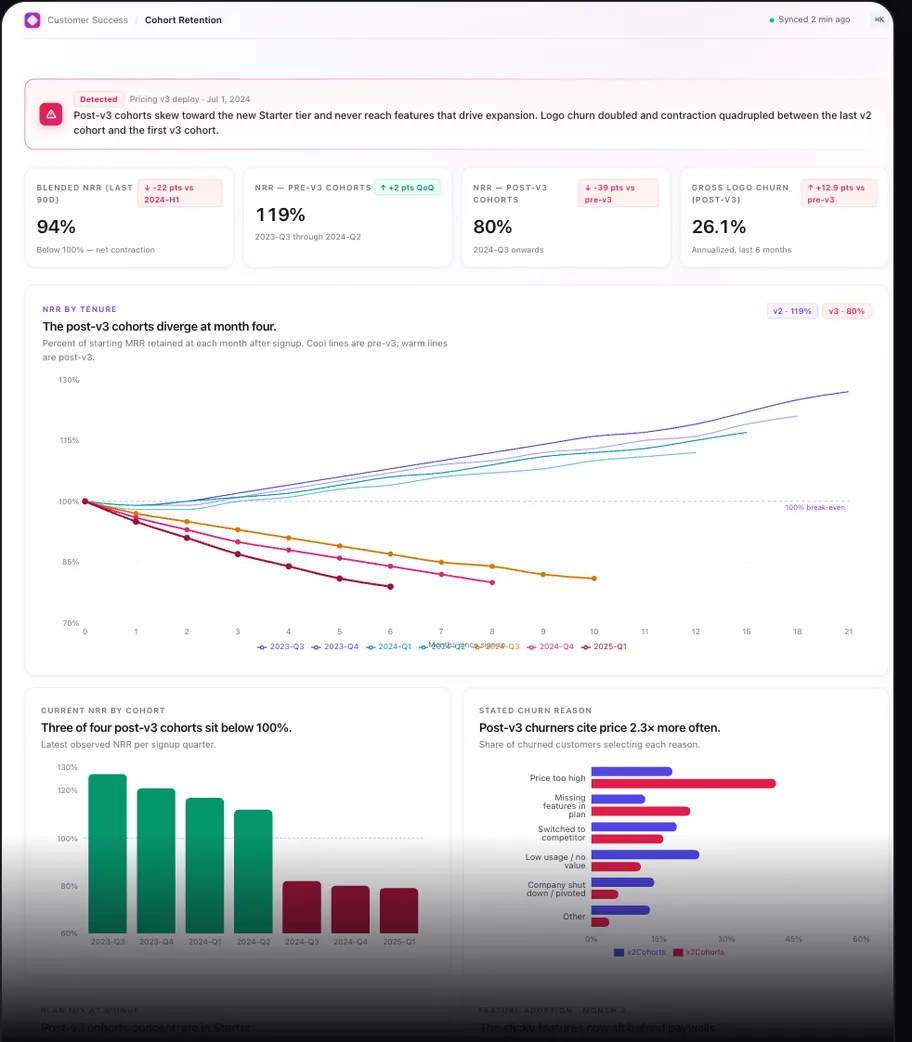
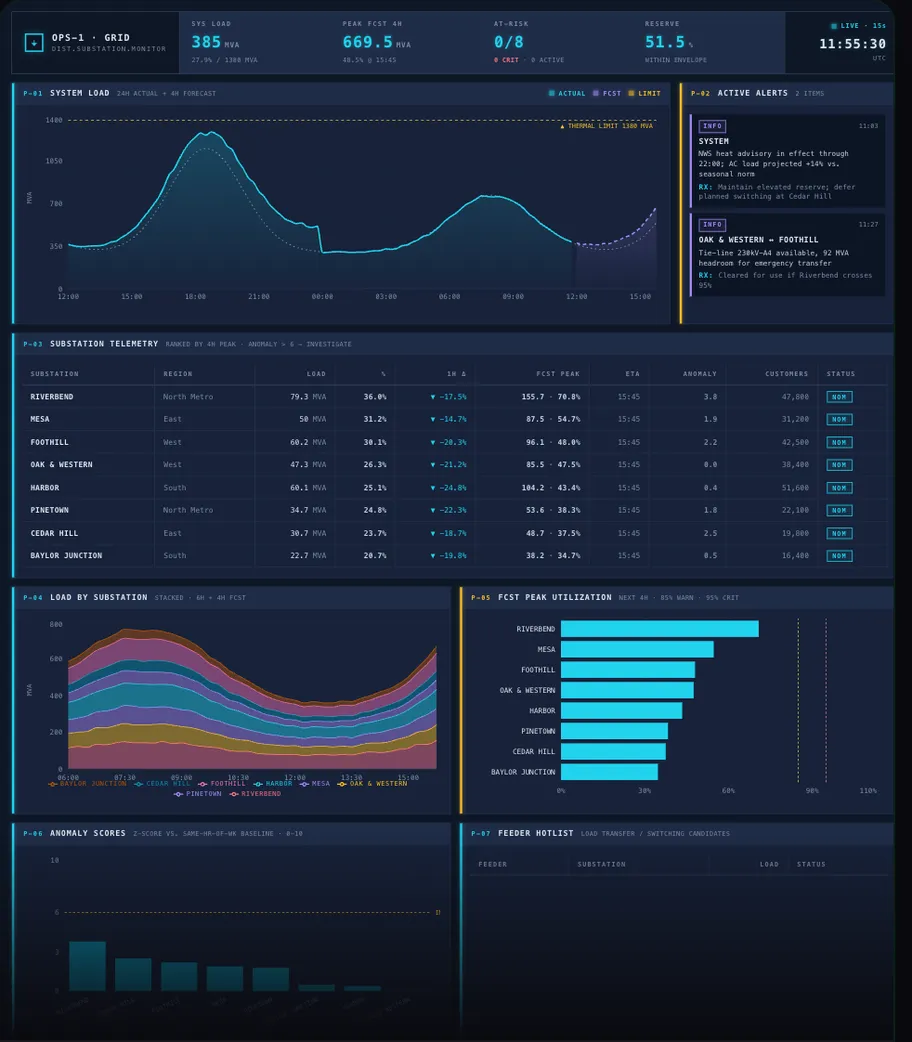
Live dashboards built with AI in seconds.
Different teams, different questions. Every dashboard built just for you.
Setup
How it works
Connect your MongoDB
Your Atlas SRV URI or self-hosted URL. Append ?readPreference=secondary and Analtra stays on a replica, never touches your primary.
find the customers who are about to churn
looking in customer and usage collections
Explore your data with the agent
Ask questions, follow threads, build charts. The agent knows your collections, joins them when needed, and shows its work.
Build live, shareable dashboards
Wired to your live data. Share via link, embed, or publish to a custom domain.
Free to start. Works with any MongoDB instance.
The MongoDB-specific advantage
Your code is the schema.
MongoDB is hard to analyze because it's schemaless. The same field can mean different things across collections, and the database can't tell you which, but your code can.
Connect your GitHub repo and Analtra reads it. The semantic layer every BI tool makes you build by hand? You've already built it.
Knows the lineage of every field
Where each value comes from, traced back to the code that creates it.
Semantic layers drift. This one can't.
Yours updates with every commit. No quarterly review, no stale data dictionary.
Skip the developer back and forth
Stakeholders get up to date field meanings directly. No more "what does this mean?" threads.
How Analtra compares
vs Atlas Charts and Knowi, the two tools MongoDB users reach for first
Built for what MongoDB teams actually need
SaaS product analytics
Your users, events, and usage data are in MongoDB. Now your product team can build and share funnels, retention curves, and cohort breakdowns. No ticket required.
Customer-facing reporting
Embed a dashboard in your product that shows each customer their own data. Analtra handles the row-level filtering, the branded link, and the access control.
Operations dashboards
Order status, inventory levels, support queues. Operations data that lives in MongoDB but needs to be visible to people who don't write code.
Investor and executive reporting
Pull MRR, churn, growth metrics, and key KPIs directly from your MongoDB collections. Share a polished, live dashboard by end of day.
When Atlas Charts is the right choice
If you're already on MongoDB Atlas, only need simple single-collection charts for internal use, and your team has the technical depth to configure aggregation pipelines manually, Atlas Charts is a reasonable starting point. It's included in your Atlas subscription and requires no additional setup. Analtra is built for teams that have outgrown that, need to share dashboards externally, want non-technical users to be self-sufficient, or are running MongoDB outside of Atlas.

Analtra
2026 Analtra. All rights reserved.